Executive Overview
Vehicle service centers run as high-volume operational environments where timing is critical. In practice, operations were fragmented across functional silos: service advisors used legacy desktop software, technicians diagnosed on paper clipboards, workshop managers tracked jobs on physical whiteboards, and customers received zero visibility until the final invoice.
Over 12 weeks, I led the product redesign targeting the real operational bottleneck: not the individual screens each role used, but the broken physical and digital handoffs between them.
Role: Lead Product Designer · Team: PM, 3 Engineers, QA, Service Operations · Deliverables: Field Research, Service Blueprint, Multi-Role System Architecture, High-Fidelity UI, Live Operational Prototypes
Measured Operational Impact
Proven Results in Live Service Operations
* Verified via live prototype testing with 15 users
across 4 operational role workflows.
Faster Vehicle Turnaround
Eliminating idle lift waiting time and manual status handoffs directly lifted daily workshop service throughput.
Less Check-in Data Entry
Paperless VIN-scanning intake replaced re-keying customer & vehicle details across legacy systems.
Customer Approval Time
SMS photo-backed estimate approvals allowed customers to approve repairs instantly from their mobile phones.
The System & Multi-Role Complexity
The platform Coordinates four distinct user roles, each operating under vastly different physical constraints and technical literacy levels:
- Service Advisors (Deskbound): Managing customer check-in, phone updates, and manual billing.
- Technicians (Workshop Floor): Inspecting vehicles under lifts, working with gloved/greasy hands, and logging parts needs.
- Workshop Managers (Operations Control): Allocating bay resources, monitoring throughput, and unblocking bottlenecks.
- Customers (Remote Mobile): Seeking status updates, transparent repair justification, and fast approval.
Operational Constraints
- Legacy Desktop Infrastructure: Existing back-office systems required re-keying customer and vehicle data across multiple software tools.
- Offline & Greasy Workshop Floor: Technicians operate under lifts with limited connectivity and gloved hands, making traditional desktop or complex form entry impossible.
- Digital Literacy Spectrum: High variation in digital literacy among floor technicians required ultra-simple, touch-first mobile interaction patterns.
Physical Context & Operational Reality
Field Research: 2 Weeks Shadowing in the Workshop
01 Workshop Floor
Noisy, Greasy Environment
Technicians work under vehicle lifts with gloved or greasy hands, making intricate touch targets impossible.
02 User Behavior
Paper Notes & Walking
Technicians scribbled notes on paper clipboards and walked 100+ meters across the floor to hand-deliver notes to advisors.
03 Digital Literacy
Low Tech Adoption Risk
Technicians resisted complex multi-step forms. Anything requiring typing slowed down active repair work.
04 Design Response
Rugged Tap & Camera Mobile UI
High-contrast 48px+ tap targets, camera VIN/photo capture, and single-swipe status updates built for floor use.
Broken Handoffs & Operational Findings
During two weeks of physical shadowing in active service bays with the cross-functional team, I mapped the vehicle journey stage by stage and identified that delays clustered almost entirely at role handoffs:
Key Insight
Core Operational Observations
- Intake Friction: Service advisors spent 45% of check-in time on manual data entry, typing duplicate customer and VIN details into legacy systems while customers waited.
- Floor Walking & Idle Lifts: Technicians had no mobile devices on the floor. After diagnosing an issue, they walked 100+ meters across the bay to hand paper notes to advisors, leaving vehicles sitting idle on lifts.
- Approval Stalls: Customer approvals took an average of 2 hours, stalling parts ordering and bay throughput because estimates were communicated via telephone tag without visual proof.
System Architecture Change
From Fragmented Silos to Unified Operations
The operational bottleneck wasn't individual screens. It was broken handoffs between deskbound advisors, paper-based floor technicians, and offline managers.
BEFORE: Broken Legacy Handoffs
01 Check-In (Advisor): Manual data entry on legacy desktop systems eats 45% of intake time.
↓ Paper clipboard handoff
02 Diagnostics (Technician): Paper notes on workshop floor; technicians walk floor to find advisors.
↓ Idle lift waiting time
03 Approval (Customer): Phone calls and manual estimates stall repairs for ~2 hours.
↓ Opaque progress updates
04 Tracking (Manager): Physical whiteboard tracking; zero real-time throughput visibility.
AFTER: Coordinated Digital Platform
01 Paperless Intake: VIN scanning pre-populates vehicle data instantly (50% faster intake).
↓ Automated digital job dispatch
02 Mobile Floor Diagnostics: Technicians log issues & photos directly on mobile from the bay.
↓ Instant photo-backed estimate push
03 Instant Mobile Approval: SMS link allows customer line-item approval in 15 minutes.
↓ Automated parts & bay trigger
04 Live Job Board: Real-time bay status & queue monitoring (25% faster turnaround).
Field Observations → Operational Results
Every major interface decision was engineered to eliminate a specific physical or digital handoff bottleneck:
Field Observation → Operational Result
Paperless VIN-Scanned Check-In
01 · Field Observation
Advisors spent ~45% of customer check-in time re-keying vehicle specifications and customer history into legacy terminals.
02 · Operational Insight
Manual re-entry caused customer queues and introduced data errors that corrupted downstream parts ordering.
03 · Design Decision
Designed a tablet-based paperless check-in flow with instant camera VIN scanning and pre-populated customer records.
04 · Measured Result
Check-in data entry time reduced by 50%, eliminating morning intake queues.
Field Observation → Operational Result
Mobile Floor Diagnostics with Photo Evidence
01 · Field Observation
Technicians logged issues on paper clipboards and walked the floor to find advisors, leaving vehicles idle on lifts.
02 · Operational Insight
Floor-to-desk handoffs caused lift idle time and delayed parts requisitioning.
03 · Design Decision
Created a ruggedized mobile diagnostic app allowing technicians to capture photo proof and request parts directly from the bay.
04 · Measured Result
Vehicle turnaround time reduced by 25%, increasing daily bay throughput.
Field Observation → Operational Result
SMS Photo-Backed Customer Approvals
01 · Field Observation
Customer estimate approvals stalled for ~2 hours over phone calls because customers distrusted verbal cost explanations.
02 · Operational Insight
Lack of visual proof caused customer hesitation and approval delays that blocked repair execution.
03 · Design Decision
Built a web transparency portal delivering SMS notifications with line-item estimates backed by technician photos.
04 · Measured Result
Approval time cut from 2 hours to 15 minutes, automatically triggering parts dispatch.
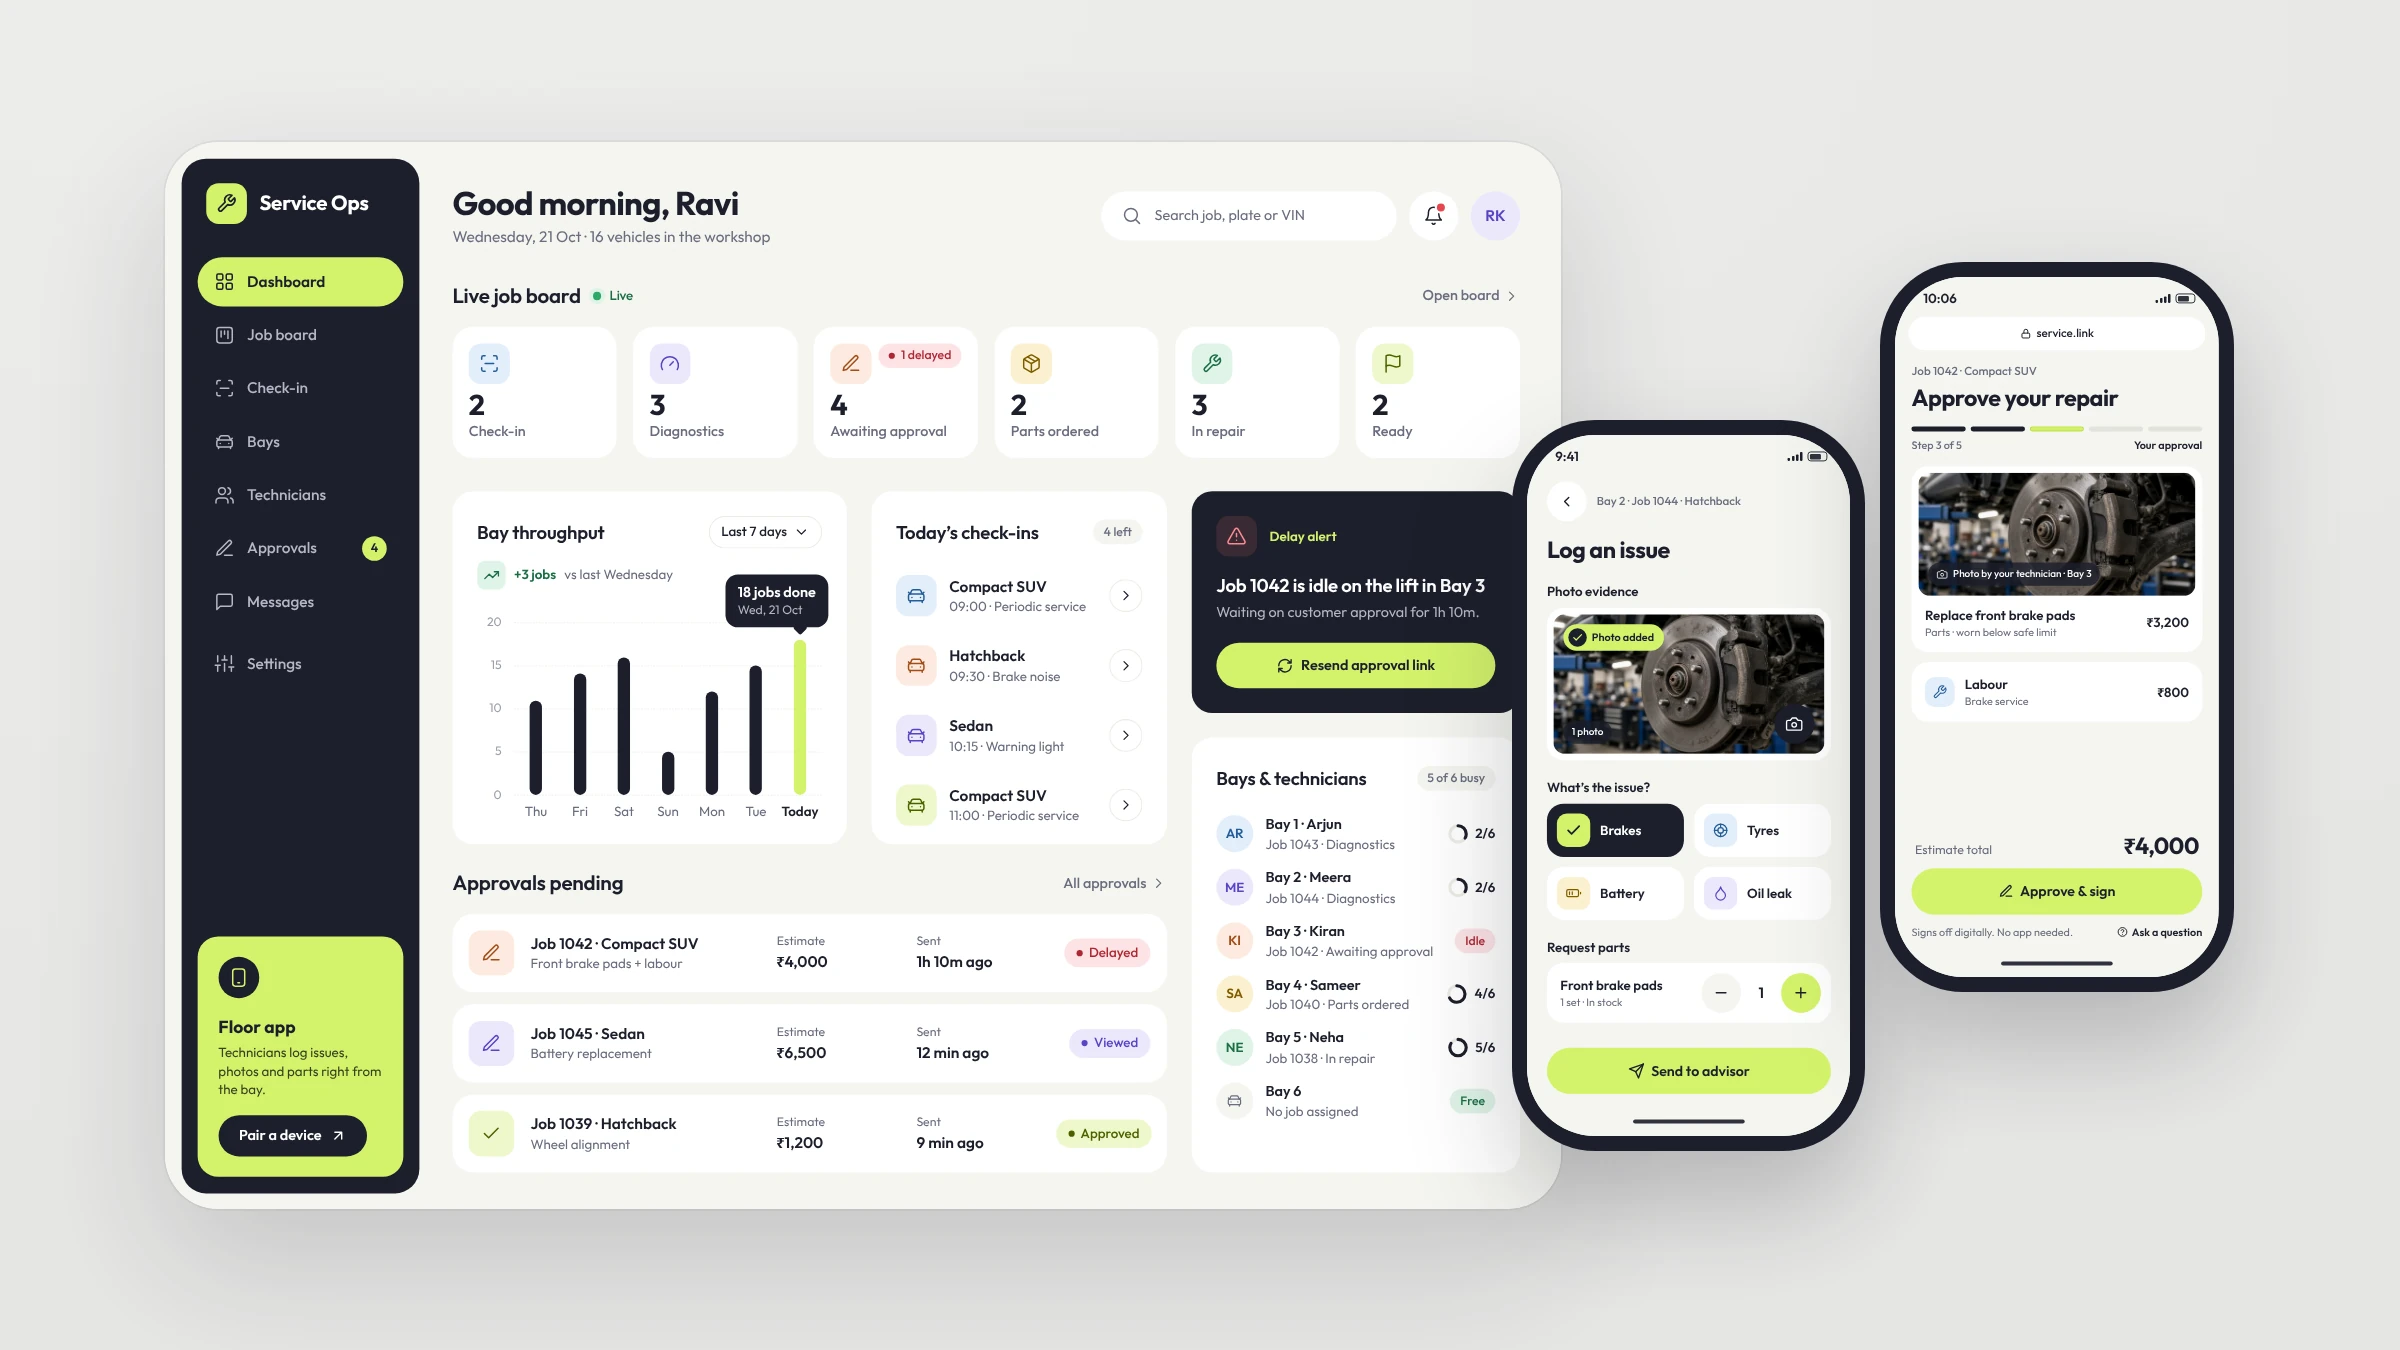
Solution Architecture: Three Connected Surfaces
The platform connects three dedicated user surfaces into a single operational ecosystem:
01 · Unified Live Job Dashboard (Service Advisors & Managers)
A real-time digital board replacing physical whiteboards. Displays live job stages, bay allocation, technician assignments, and automated delay alerts.
Unified Operations Dashboard
02 · Mobile Technician Diagnostics (Floor Technicians)
A touch-first mobile interface optimized for low digital literacy and shop floor use. Features single-tap issue logging, camera photo capture, VIN scanning, and automated parts requisitioning.
03 · Customer Transparency Portal (Vehicle Owners)
A mobile-web portal requiring zero app installation. Delivers SMS progress tracking, photo-backed repair line items, and instant digital sign-off.
Product Experience & High-Fidelity Screens
Multi-Role UI System
Design Decisions Behind the Interfaces
- I OWNED: End-to-end service blueprinting, physical workshop field research, multi-role design system architecture, and high-fidelity interface design.
- I DECIDED: To replace complex multi-field diagnostic forms with camera-based photo evidence capture, accommodating technician digital literacy while providing proof for customers.
- I VALIDATED: Conducted live operational testing with 15 users (advisors, technicians, managers) across active workshop shifts to refine touch target sizes, contrast ratios, and handoff triggers.
Live Operational Validation & Impact
Working alongside the team, I validated the platform by deploying interactive prototypes into active service center operations, testing with 15 staff members across 4 distinct roles.
Measured Operational Results
- 25% Reduction in Turnaround Time: Driven by the live job board and automated status handoffs I designed, which eliminated technician floor walking and lift idle time.
- 50% Reduction in Check-In Data Entry: Achieved through the paperless intake and automated VIN scanning workflow I designed.
- 2 Hours → 15 Minutes Approval Time: Enabled by the SMS photo-backed estimate experience I designed, which gave customers instant visual proof to approve repairs on their phones.
Enterprise UX Reflections & Takeaways
- Physical Context Dictates UI Design: Designing for a noisy, greasy workshop floor requires fundamentally different interaction patterns than quiet office software: high contrast, 48px+ tap targets, and camera capture over typing.
- Workflow & Handoffs Matter More Than Screens: Enterprise productivity is rarely blocked by single-screen usability; it is blocked by broken handoffs between roles and legacy system silos.
- Enterprise UX Is Systems Design: Designing enterprise software requires understanding physical human movement, operational incentives, legacy technical constraints, and multi-role coordination.
Previous Project
← Clarity: AI Decision Intelligence PlatformNext Project
MicroDrama →